There has, of late, been a certain amount of punditry about “style rotation” within equity markets. Will last year’s outperformance of “value” over “growth” resume, or did the resetting of valuations set the stage for “growth” to romp home by a country mile?
This line of thinking is based on the idea that companies can be meaningfully categorised as offering either good value or growth prospects. I bridle at this, since “growth” and “value” are not mutually exclusive, but more than this, because classifying thousands of companies into one of two categories doesn’t convey as much meaning as the labels suggest. Despite these misgivings, it does at least provide a lens onto the stock market, at more than just an overall index level.
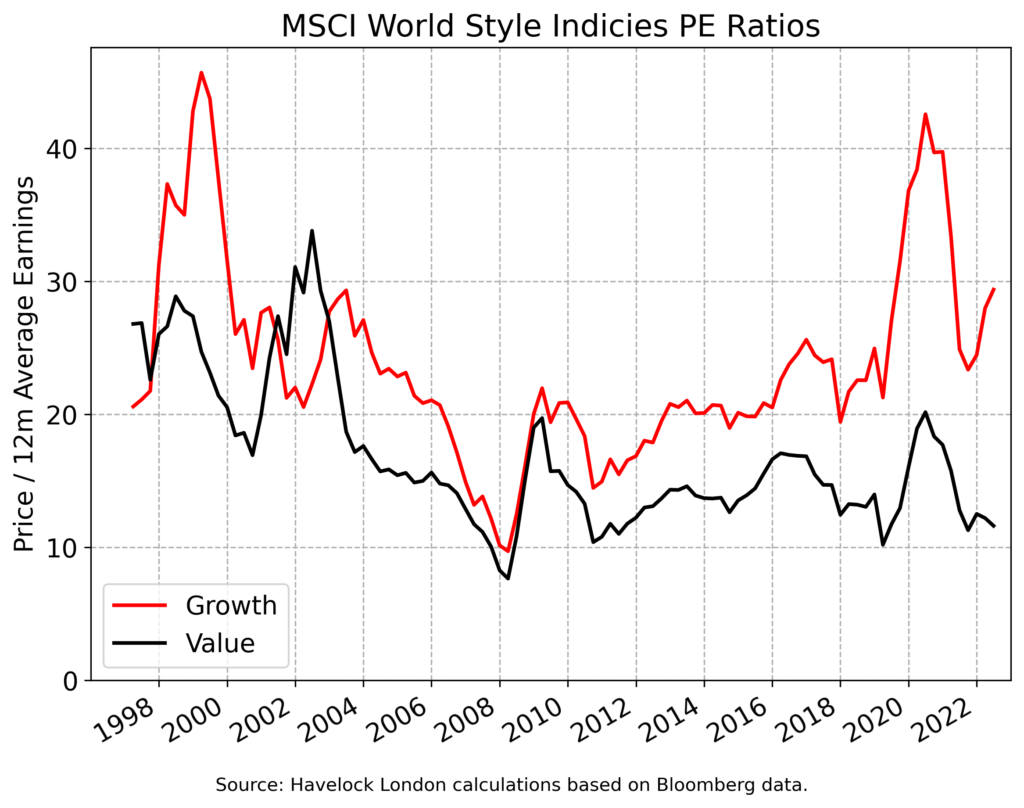
The index provider, MSCI, maintain style indices, that classify companies as either growth or value based on backwards looking quantitative measures. In the last decade, investors have been willing to pay increasingly high multiples of earnings to own the constituents of the growth index, as illustrated below. This was punctuated by the growth index seeing a large “multiple contraction” at the end of last year, which is what prompted talk of a “style rotation”.

It is not obvious that the constituents of the growth index were left looking cheap at the end of last year, and it would be hard to argue that there had been a “reset” in valuations. Far from the “rotation” being over, the chart begs the question if it ever really began! Nonetheless, the devotees of “buy the dip” appear to have been at work of late, as in valuation terms, the growth index has now regained much lost ground.
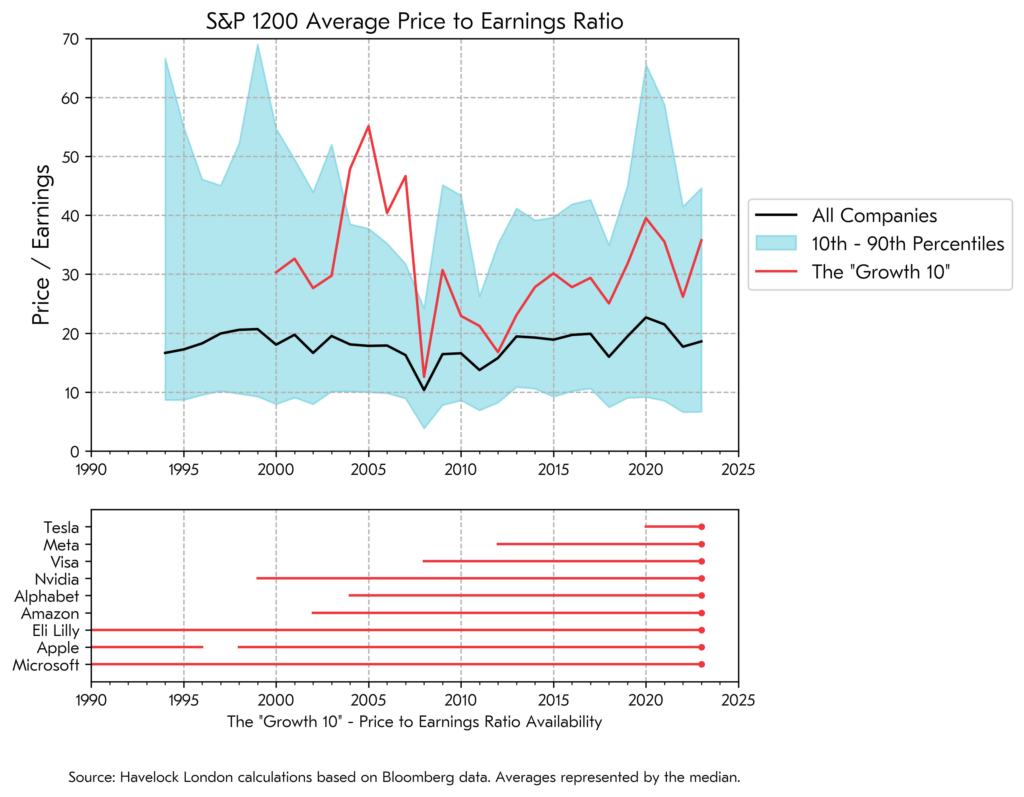
There are many ways in which this sort of broad brush analysis can deceive, and the growth index has increasingly become a proxy for a cohort of large companies popular with investors. To illustrate this, the MSCI growth index has a 37% weight in its ten largest constituents, all of which are US companies and most of which are “big-tech”. I will label these companies the “Growth 10”, albeit that due to both of Alphabet’s share classes appearing in the list there are only actually nine separate companies.
The graph below shows the average price earnings ratio of the constituents of the global S&P 1200 index, together with the range of their valuations (ignoring the “cheapest” and most “expensive” ten percents). The historic average valuation of the Growth 10 is overlayed in red. The graphic also illustrates the available history for the Growth 10, determined both by their age and having delivered positive earnings such that a price earnings ratio is available to contribute to the average.

This analysis makes it clear that this small cohort of companies have seen their valuations rise to be far higher than the typical company, and higher than for much of their own history. Does it make sense that these companies should command their highest valuations, after a protracted period of profits growth, rather than before? May be trees do grow to the sky, after all.
I think that looking at a small cohort of popularly owned companies makes for a better lens on which to view the current dynamics of the equity market. It strips away the abstract notions of “growth” and “value”, replacing them with something more concrete. It suggests that those investors who are hoping that “growth” will deliver for them, may implicitly be betting that the very biggest companies can both outgrow the rest of the stock market and continue to demand elevated valuations. This may happen, but it is not a horse that I wish to back.
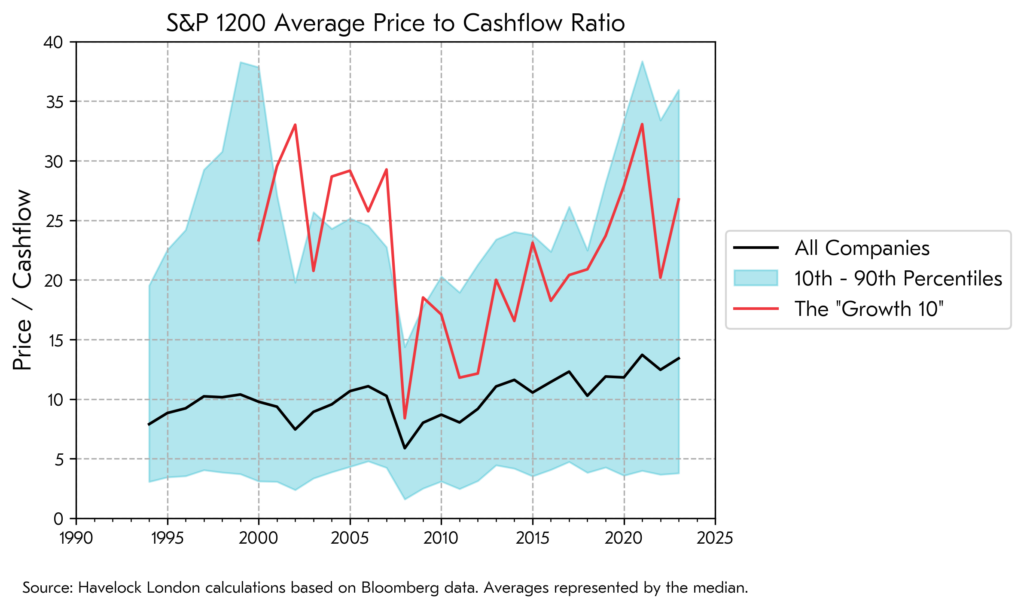
An alternative measure of “expensiveness” is to look at share prices relative to cashflows, rather than earnings. Viewed through this lens, the valuation of a typical company looks much more elevated versus history.

The two different stories that these metrics present, tells us that corporate profits have increased by more than cashflows. A cynic would suggest that this is because the bean counters have, for many companies, increasingly used the accounting rules to paint a flattering picture. This should give all investors pause for thought. More than this, those investors who are paying more than 25 times current cashflows to own a business, really must believe there are sunnier times ahead.
There are reasons to think that the prospects for economic growth will be challenged in the near term. High levels of government and corporate debt taken on when interest rates were much lower, corporate profit margins at very high levels, an anti-globalism political climate, and ageing populations, all make for heavy going. The rise in labour disputes tells us that many workers are unwilling to quietly watch inflation lower their standard of living, raising both the prospect of further inflation and a drag on profit margins. Against this backdrop the very largest companies will have to run hard to outpace the overall level of economic growth.
The constituents of the Growth 10 are all great companies. Self evidently. However, I am not backing these front-runners, as I believe great companies only make for great investments at the right price. This is not to say that they won’t be winners, but that I see better odds elsewhere.