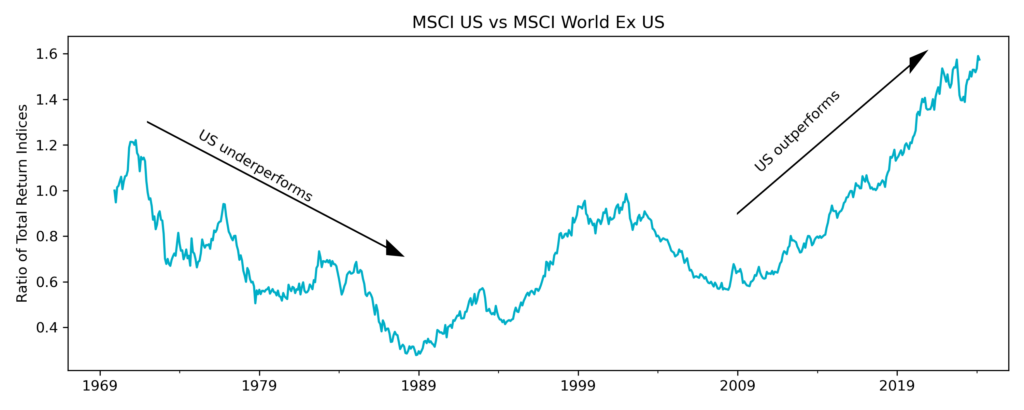
The performance of American public equities since the Global Financial Crisis has been exceptional, with the result that they account for more than 70% of the MSCI World index. This is demonstrated in the chart below, that shows the relative returns of owning American equities versus other developed markets.

The chart also shows that there have been periods of time when the reverse has been true, with the returns from US equities lagging the rest of the developed world during the 1970s and 1980s. This pattern of prolonged periods of under and over performance held for the entire twentieth century[1], despite the long-term trend of US dominance versus “old world” economies.
The technological revolution that we are currently living through has very much been centered in the US, meaning that it has spawned many of the world’s largest and most profitable companies. The outperformance that is shown above tells us nothing about the growth in earnings power in US companies, and the extent to which it has also outpaced the rest of the world.
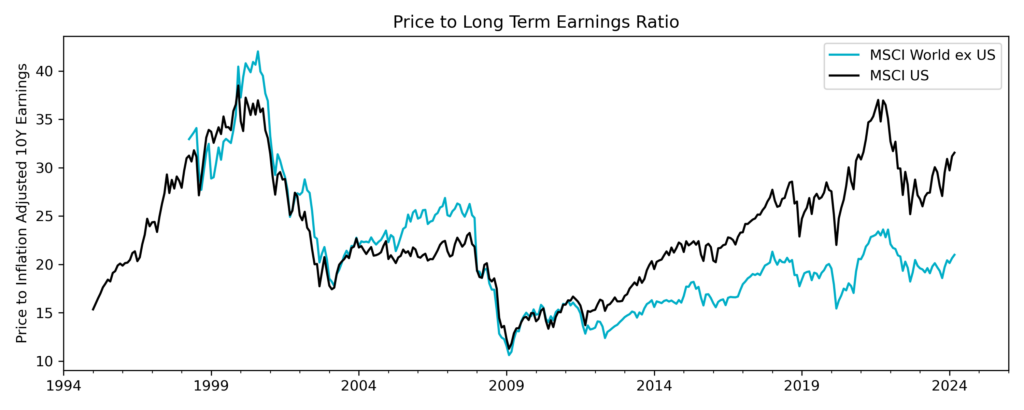
The MSCI US index currently has a price-to-earnings ratio of 25x, versus the MSCI World index ex US having a ratio of 15x. This tells us that US companies look more expensive than their developed market counterparts, based on their previous year’s earnings. On this basis, the US index has become progressively more expensive in the last decade, which is only rationalised by a growing belief that future earnings have much higher growth yet to come.
The “Magnificent Seven” companies account for 28% of the MSCI US Index, and so have become the focal point for US equities. They have been the driving force of strong earnings growth, strong share price performance and high valuations. The next chart shows the average net profit margin for the group of seven, which is the fraction of their sales left over after they have paid all operating expenses, finance costs, and taxes. On this basis these companies have never had it so good.

The average price earnings ratio for the Magnificent Seven is 37x last year’s earnings, meaning that they appear markedly more expensive than the MSCI US index on 25x earnings. To justify this valuation, they either need to see strong sales growth or increase profit margins[2]. At their current size, growth in relative terms corresponds to large quantities of incremental sales in absolute terms, which is a challenge. Likewise, growing margins from current peak levels will also be a challenge.
I cannot know that the premium investors are currently paying to own US equities, and specifically the Magnificent Seven, will not eventually be justified by higher earnings. What I do know is that because much growth is already “priced in”, there is a substantial risk of disappointment if they fall short. The dominance of these companies means that many portfolios will, like the passive MSCI World index, have a concentrated exposure to this risk.
The next chart shows the price to ten-year average inflation adjusted earnings for the MSCI World and MSCI World ex US indices. This tells us that if long term average earnings were to be a good guide to the future, then US equities currently look very expensive. For the Magnificent 7 this ratio is, on average, 65x, making them look more expensive still.

We do not want to rely on optimism, and are particularly cautious about requiring record-high profit margins to justify an investment. We see plenty of opportunities where only modest expectations for the future are required, for valuations to be attractive. This “glass half empty” approach means that we do not currently own any of the Magnificent Seven, despite the fact that they are attractive businesses. Put simply, we believe a good business only makes for a good investment at the right price.
Source: All data used in charts and commentary is sourced from Bloomberg.
[1] See https://globalfinancialdata.com/the-united-states-or-the-rest-of-the-world
[2] They can also grow earnings by buying back shares, but this is not very value accretive at current valuations.