This week the International Monetary Fund warned of a “widening disconnect” between geopolitical uncertainty and stock markets, hinting that valuations have become disconnected from reality. This follows similar such warnings in the last couple of weeks from the UK Financial Conduct Authority and the Bank of England.
Given that financial markets appear full of optimism, it left me wondering if now is a good time for investors to be heeding these warnings?

As I reflected on this I began to feel like Corporal Jones, in the very British comedy Dad’s Army[1]. Jones can be relied upon to work himself up into a veritable frenzy, with the joke being that he repeatedly tells others “don’t panic don’t panic” whilst being the only person in the room to show any concern whatsoever about the next impending calamity.
The extreme market moves in August served as a stark reminder of the fragility of financial markets, and how little is really understood about the liquidity that underpins them. Time will tell if it proves to have been the “canary in the coal mine” for a deeper market panic, but having the FCA, IMF, and Bank of England all reference it is a sign that it definitely “rattled their cages”.
Nikhil Rathi, the CEO of the FCA, delivered a speech[2] at the start of October titled “Predictable volatility”, where he expressed the view that “things that used to be one-in-10-year events now happen every month”. He specifically spoke about factors beyond “familiar geopolitical concerns”, highlighting the growing role of technology, increased concentration in both stock indices and the financial system, tougher liquidity conditions, and increased interconnectedness, as sources of risk. His view that “new systemic risks” need “deeper examination”, is a concerning reminder that even those responsible for regulating financial markets struggle with their growing complexity.
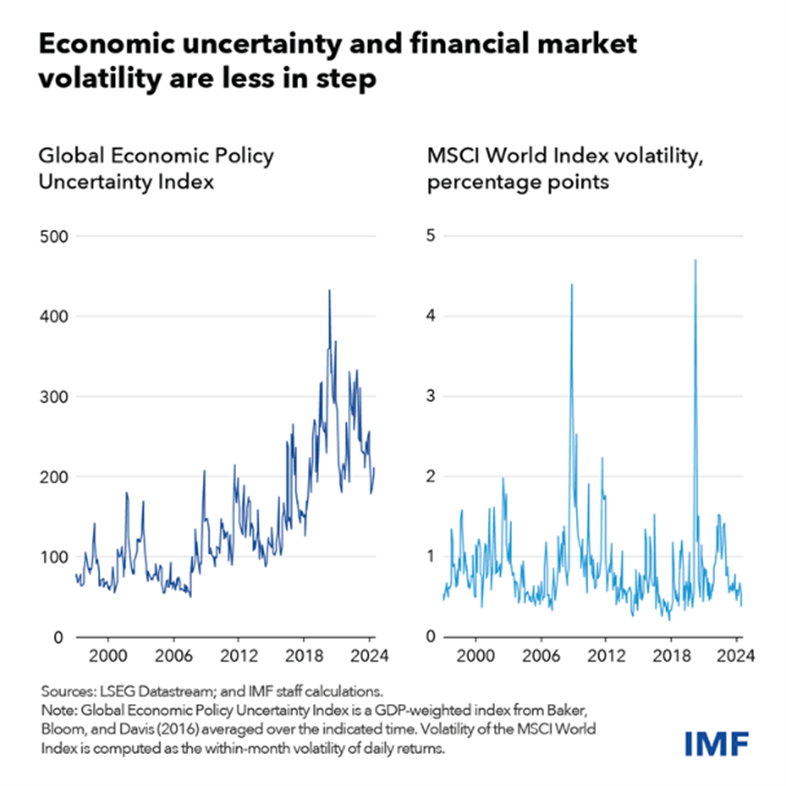
The chart below[3] is from the IMF’s Financial Stability Report and illustrates the focus of their concern. It shows how they simultaneously see a very high level of geopolitical uncertainty, whilst financial market volatility is close to an all-time low.

You would have to be living in a cave to not be aware of the sources of rising geopolitical tension, but equity markets appear to have largely “shrugged them off” as not relevant. As I wrote this piece, headlines emerged of North Korea sending troops to fight in Europe – Ukraine still being a European country. I never imagined reading such a headline in my lifetime, yet this genre of news seems to be judged as far less attention worthy than AI powered robotaxis. Don’t Panic!
The minutes of the Bank of England Financial Policy Committee in October[4] stated that equity markets were at “stretched” valuations, leaving them “susceptible to a sharp correction”. They specifically highlight that hedge fund shorting of US Treasuries reached a new $1 trillion high, and the risk that a disorderly unwinding of this could disrupt markets. They went on to discuss “pockets of vulnerability among highly leveraged corporates, including private equity backed businesses” and “challenge faced by corporates that need to refinance their debt”.
S&P estimates[5] that there will be $7.3 trillion worth of corporate debt that needs to be refinanced in the next three years. For investment grade “BBB” credit, they estimate that borrowers will see their finance rate increase by around 2%, given that most maturing debt was issued at a time of record low interest rates. The task many companies face is to both find someone willing to lend to them, and then be able to meet the subsequent higher interest costs. That much of this activity has moved outside the purview of public markets, and the “constipation” within private equity when it comes to selling investments, add to my discomfort.
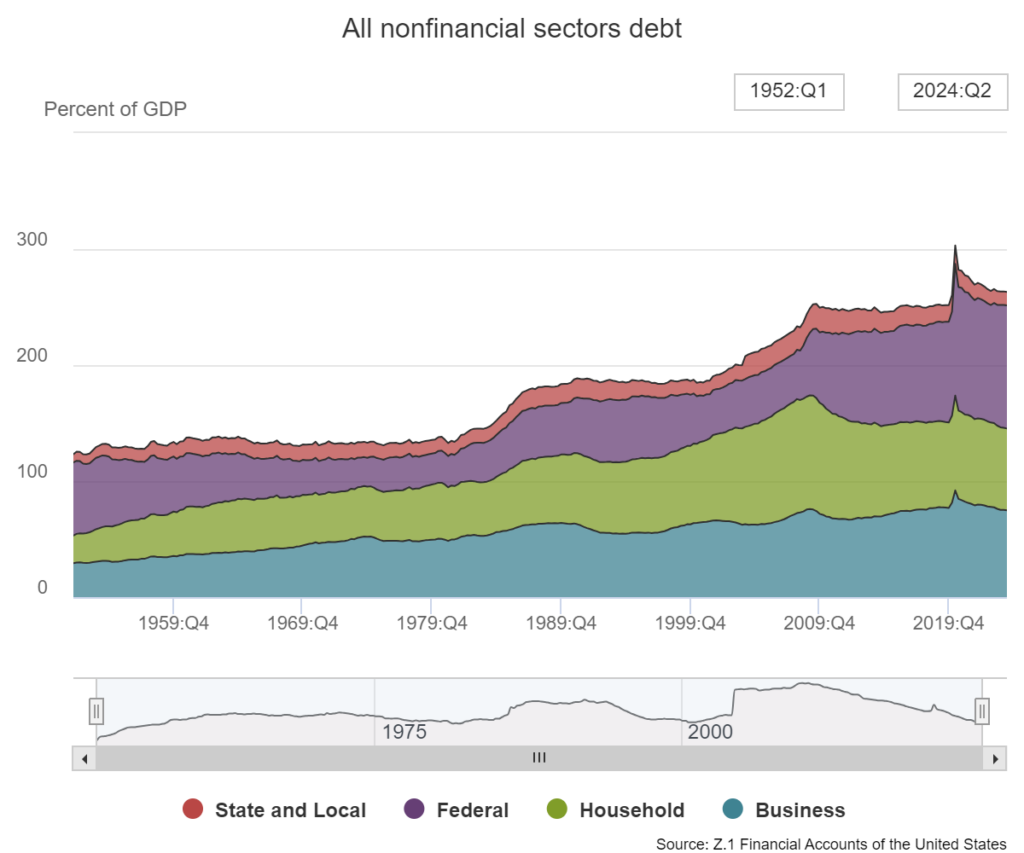
The chart below shows the debt to GDP ratio in the US since 1952, broken down by category of borrower[6]. The picture looks the same for most other developed market countries, which is that debt levels are at record highs. As these borrowings get refinanced at higher rates, more money is required to service the debts. This story isn’t new, and I am sure you will have seen variants of this chart before. Nonetheless, the “problem” isn’t going away, and in the years ahead I see a risk of lenders being shortchanged by defaulting borrowers, long-term inflation, and or financial repression.

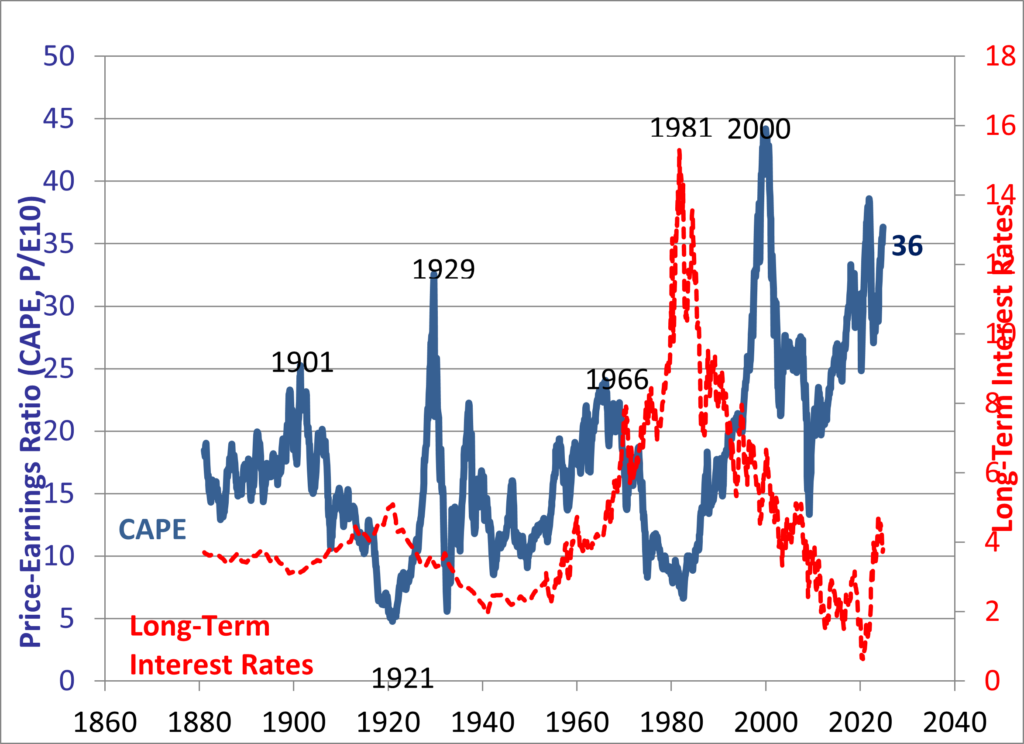
There are multiple top-down ways in which I can show that parts of the equity market look expensive versus history. The chart below is Robert Shiller’s Cyclically Adjusted Price Earnings Ratio[7] for the US equity market, highlighting just how expensive it appears relative to historic earnings. On this basis the only times when the broad market has been this expensive are 1929 and 2000. Don’t panic!

I am all too aware that using a measure, such as this, to warn of impending doom makes me the Corporal Jones of the equity markets. This, and similar metrics, have been elevated for long enough that they are normalised, and so don’t appear to be reason for panic. Ink has been, and will continue to be, spilt on why this is so. Perhaps it isn’t so extreme due to a nuance of accounting, or perhaps the Federal Reserve will now always backstop markets such that valuations have reached a “permanently high plateau”. I believe that only time will tell if “this time is different”, but that it seems dangerous to assume that it must be so.
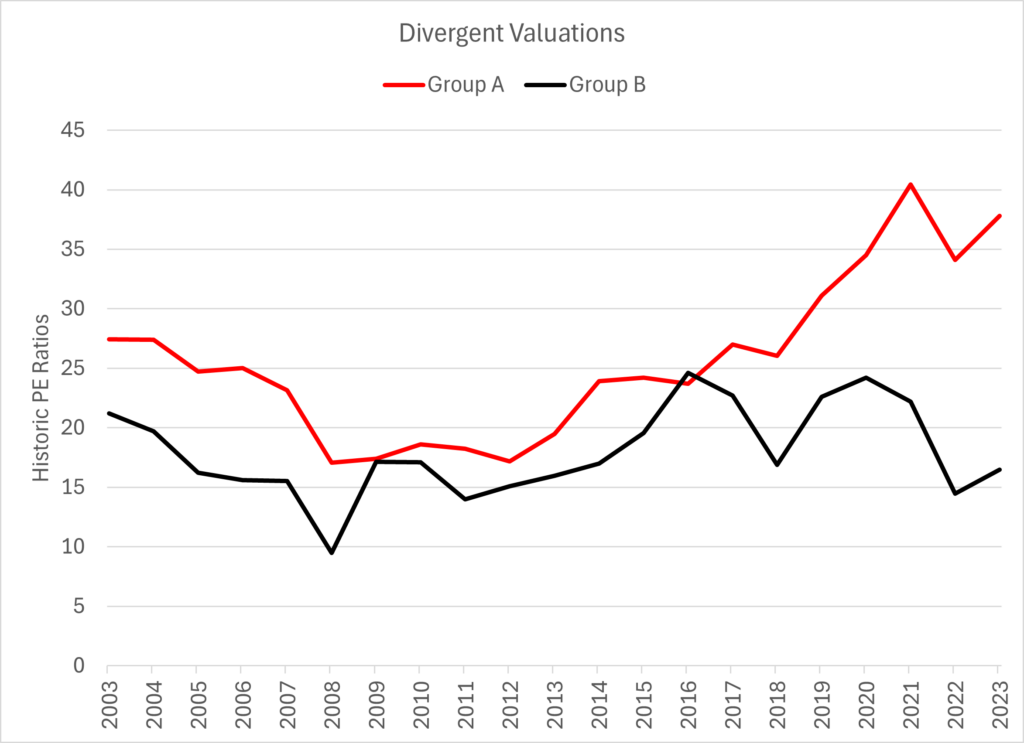
Switching to look “bottom up”, the next chart shows the average price earnings ratios of two groups of four companies that I picked from the S&P 500. I deliberately didn’t label them “growth” and “value”, but “Group A” are example holdings from growth portfolios, and more generally popularly owned, whereas “Group B” are not. All eight companies are businesses that I admire, and at the right price would consider owning. None are currently in our portfolio (but don’t read too much into this).
Group A contains Microsoft, S&P Global, Cost Co and Stryker Corp. Group B contains Deere & Co, Exxon, Target and Home Depot. Although somewhat arbitrary, I picked them as examples of the extreme divergence of valuations that we see at the coal face in our day-to-day work.

The chart illustrates how the valuations of companies that I view as popular amongst investors, have diverged from those that are not. Is it the case that the best days for “Group A” lie ahead of them, whilst “Group B” are on a glidepath to extinction? The gap in valuations suggests this to be the consensus view.
Although I cannot know which of these companies represents the best investments, clearly those in Group A have a much higher hurdle to clear in order to deliver on current expectations. In my opinion there is a distinct risk that many portfolios will find themselves concentrated towards the most expensive parts of the market, whether this be due to the use of passive products, or active funds that have laid down strong track records by investing in these areas.

Corporal Jones’ colleague, Private Frazer, would, I am sure, have been a value investor. His prognosis for most situations was that “we’re doomed”. As tempting as it is to reach for me to reach for this conclusion, I do not think it to be the case (if it were I certainly wouldn’t have almost all of my net wealth invested in the Havelock fund).
You can construct a version of the future where an AI productivity boom means that we aren’t doomed. High levels of economic growth could shrink levels of indebtedness, and justify the stretched valuations of many stock market darlings. Although possible, I think it unlikely.
The reason why I think we aren’t doomed is because there are many parts of financial markets that are out of favour, such that valuations look reasonable. In some areas this is in turn driving underinvestment, such that I believe the stage is set for scarcity to actually lift returns on capital.
Our approach of understanding companies from the ground up, and only investing when the valuation appears to offer a margin of safety looks, much like Dad’s Army, old fashioned. Prices appear to be increasingly anchored on short-term news, at the expense of long-term prospects. A simple example of this being “cyclical” businesses, where it clearly makes little sense to focus intently on just a single year’s earnings.
A further part of our approach is to try to create a portfolio that can weather storms, rather than one that is configured to expect only fair weather. This approach served us well in 2022, and the market dislocation in August was a clear reminder of why it remains relevant. To this end, we have researched and invested in several new ideas that we think of as “anti-fragile”. These are investments where we believe that chaos in the world order could see their valuations move higher. We don’t pretend to be able to predict how or when this might happen, but view them as a welcome form of diversification.
An example of this is a US natural gas production company. Thanks to the shale boom, US natural gas is the cheapest molecule of energy on the planet, and has helped reduce CO2 emissions by displacing the burning of coal. Due to a continued ramp up in US export capacity and demand from AI data centres, the market has the potential to move into a supply deficit in the years ahead. Given this and a modest valuation we see it as an attractive investment. In the scenario that global energy markets are severely disrupted it would become only more attractive.
The underinvestment in the energy sector is characterised by the MSCI World index having a 3.9% weight in the entire energy sector, versus 4.3% in each of Nvidia and Microsoft. This mirrors other capital-intensive sectors that have been starved of capital. This creates scarcity, which is something that we think can underpin long-term value.

Clearly the approach that I advocate draws us into certain out of favour areas, which creates discomfort. This is in stark contrast to many portfolios that are invested solely in the most popular parts of the market. This squarely includes passive investing, where right now the largest allocations are to the most expensive companies. I believe that the prolonged period of rising valuation multiples has left many investors thinking that this conventional approach is without risk.
John Maynard Keynes said that “worldly wisdom teaches that it is better for reputation to fail conventionally than to succeed unconventionally”. It is thus that most investors won’t panic until it is too late.
Our current portfolio has a price earnings ratio of 12x, and a ratio of just 10x against expected earnings for next year. Whilst providing no guarantee of success, it means that we don’t need to be investing with unbridled optimism, because we are not reliant on unprecedented levels of earnings growth or multiple expansion. I don’t think we are doomed, but I think a little more panic might prove wise!
[1] https://youtu.be/nR0lOtdvqyg
[2] https://www.fca.org.uk/news/speeches/predictable-volatility
[3] https://www.imf.org/en/Blogs/Articles/2024/10/15/how-high-economic-uncertainty-may-threaten-global-financial-stability
[4] https://www.bankofengland.co.uk/financial-policy-summary-and-record/2024/october-2024
[5] https://www.spglobal.com/ratings/en/research/articles/240729-credit-trends-global-refinancing-update-q3-2024-near-term-risk-eases-13198445
[6] https://www.federalreserve.gov/releases/z1/dataviz/z1/nonfinancial_debt/chart/#units:percent-of-gdp