Much ink has been spilled on the relative merits of “growth” verses “value” stocks. As there are around 90,000 public companies classifying them into one of two groups is, by necessity, always going to be a little vague! So much so, that I wonder if these labels convey as much meaning as many assume? Our ideal investment would represent both good value and have good growth prospects.
What follows is a tale of two businesses that for now I shall call “Company A” and “Company B”. We are shareholders in one of these businesses, but not the other, and the story is intended to show you what we look for in an investment. Company A makes Windows whilst Company B makes ploughs.
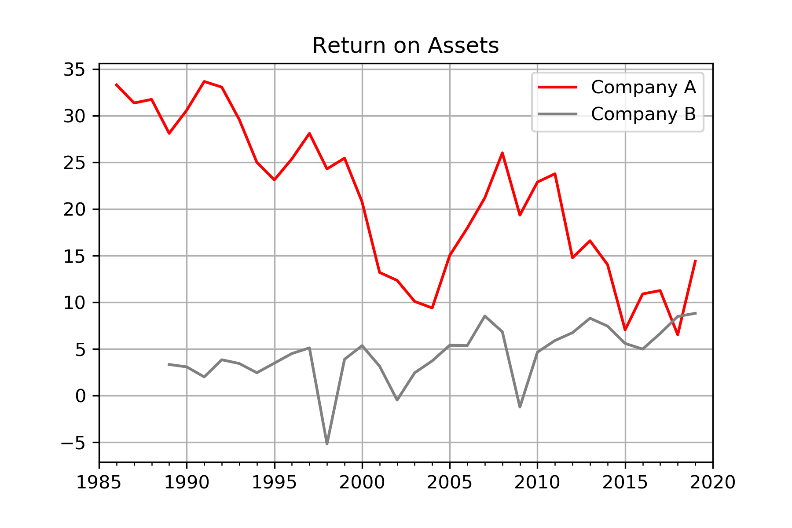
Company A has a history of making high profits, but with the passage of time their business has become more “asset intensive” – they need more “stuff” to turn a profit. Company B has been comparatively much less profitable but improving. Despite Company A’s magnanimous past, the companies now look to deliver similar levels of profitability from this perspective. This can be seen in the chart below that shows historic profits as a percentage of the value of assets used in each business (for anyone schooled in accounting, you will recognise this as the “return on assets” ratio).

Source: Havelock London calculations using Bloomberg data.
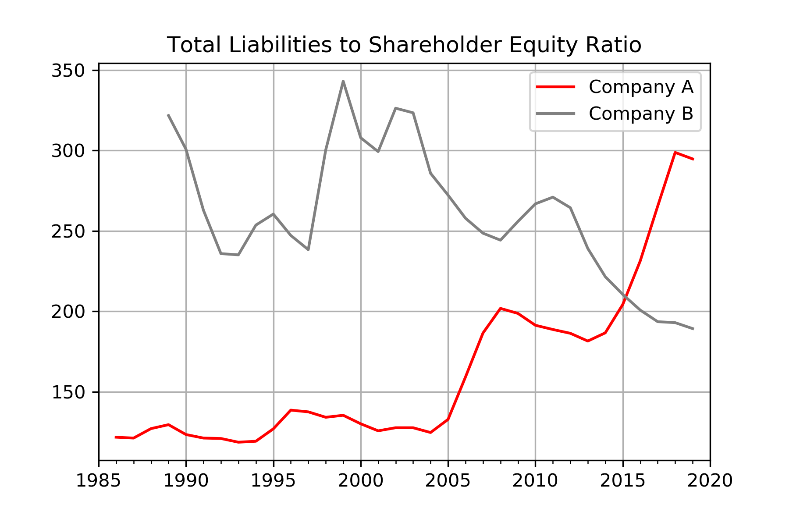
In recent history Company A has been increasing their borrowings, whilst Company B has reduced theirs. The falling profitability of Company A’s underlying business has, in part, been compensated for by their increased use of leverage. By the opposite token Company B has decided to decrease their leverage. This is illustrated in the next chart that shows the size of each company’s liabilities, relative to the amount of shareholder equity they employ.

Source: Havelock London calculations using Bloomberg data.
In the last decade Company A has paid out almost all their profits in dividends and share buybacks whilst funding their growing asset base with leverage. By the opposite token Company B has reinvested more than half their profits back into growing their business. Company A has seen much higher revenue growth than Company B but the same is not true of their earnings growth. (I calculated this by looking at total profits in the last ten years, relative to the ten years prior. This avoids one extreme year causing a wonky reading and smooths out the impact of earnings volatility.)
| Last Ten Years | Company A | Company B |
| Profits Reinvested | 4% | 59% |
| Revenue Growth | 115% | 45% |
| Profits Growth[1] | 95% | 141% |
Source: Havelock London calculations using Bloomberg data.
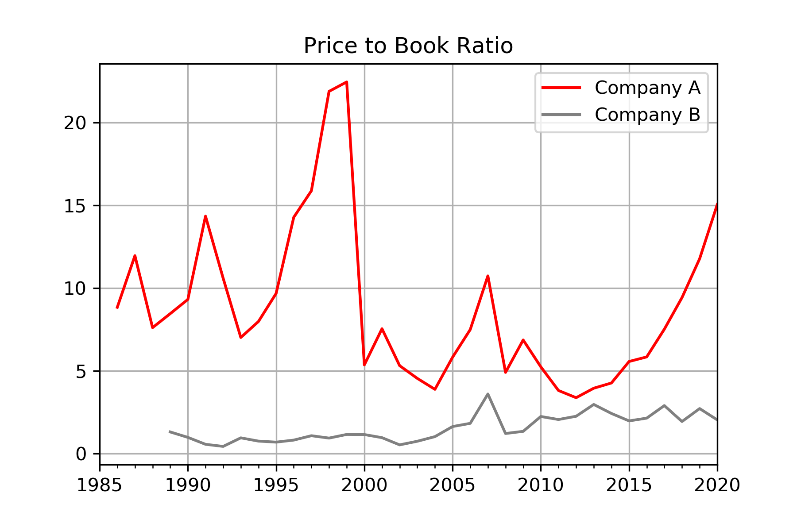
The final piece of the story is a chart of the price to book ratios of the two companies. Company A has commanded a distinct premium valuation in comparison to Company B. This was well justified for much of history because their underlying business was so much more profitable, as illustrated by their superior return on assets. As of 2019 the two companies have more similar levels of underlying profitability, but we have seen that Company A has leveraged these returns by making much greater use of leverage. Company B on the other hand has reduced their use of leverage.

Source: Havelock London calculations using Bloomberg data.
Company A has a price to earnings ratio of 36.4 and Company B 12.6, so simplistically A is three times as expensive to buy as B. By most accepted definitions Company A is classified as a “growth” stock, whilst Company B is classified as “value”.
Company A is a truly great business, but we would not invest in it at the current high valuation. We invested in Company B because of its respectable and improving profitability, its low leverage, and its reasonable valuation. On top of this the “value stock”, Company B, has seen as good levels of earnings growth in the last ten years as the “growth stock” that is Company A. Clearly, the shortcoming of this exercise is that I am looking at the past, not what is expected in the future. Likewise, Company B’s earnings have been more volatile. Nonetheless it gives me pause for thought on the use of “value” and “growth” labels and if this wide disparity in valuations is justified.
For anyone that has made it this far your reward is to know that Company A is called Microsoft (I told you that they made Windows). As Company B is not one of our top 10 holdings, we do not disclose its name.
I do not know if Microsoft will have higher or lower future earnings growth than the industrial company that we have invested in. That was not the point I wished to make. My message is that I believe that the labels of “growth” and “value” are a poor substitute for proper analysis and may not be as descriptive as they first appear. In this case the “tech” business looks to be as asset intensive as the industrial one, with similar levels of long-term profits growth. Furthermore, a great business, such as Microsoft, will only make for a great investment at the “right” price. The more an investment is seen as a “sure thing”, and the higher the price moves, the lower the chances of the price being “right”.
[1] Measured based on total profits in the last ten years, relative to total profits in the prior ten years.