The grandfather of value investing, Ben Graham, famously said that “in the short run, the market is a voting machine but in the long run, it is a weighing machine”.
What Graham meant is that in the long-term market prices move to reflect the economic fundamentals of companies, whereas in the short-term they are dictated by the whims of market participants. By “economic fundamentals” I really mean the earnings that a company generates for shareholders, as measured by either the rules of accounting or cashflows. Graham’s opinion that prices move much more than is justified by earnings was validated in the 1990s by the academic Robert Shiller, for which Shiller was later awarded a Nobel Prize.
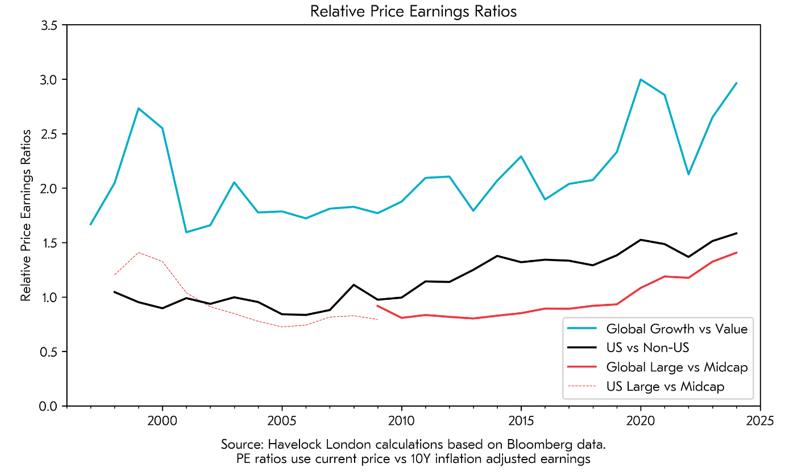
The chart below shows the relative expensiveness of “growth” versus “value” companies, US versus non-US companies, and large versus mid-size companies[1]. The lines tell us the extent to which investors are currently willing to pay a premium to own the former, over the latter.

This shows that the premium to own growth companies, US listed companies and large cap companies appears to be as high as it has ever been in the last 30 years. As value investors we think this trend is more likely to reverse than continue.
We believe these premiums are the product of the “voting machine”, with the enthusiasm that many investors have for certain companies running well ahead of a reasonable expectation of their ability to generate earnings. The counterargument, based on the “weighing machine”, is that the premium investors are paying is because a select group of companies are likely to grow earnings at a much faster pace than they have done historically.
Our portfolio is not just focused on value companies, but is currently also exposed to non-US listed mid sized companies. This is because it is where we see opportunity. The fund has made money in each of the five calendar years that it has been running, but the trends that I describe mean that its relative performance has faced multiple headwinds. If these trends reverse, the fund stands to benefit, as they should move to become tailwinds to our performance. We cannot know if, or when, this might happen, but we believe history is on our side.
In short, we believe our fund provides exposure to the “weighing” machine, not the “voting” one.
Appendix
The table below outlines the data that was used to produce the chart:

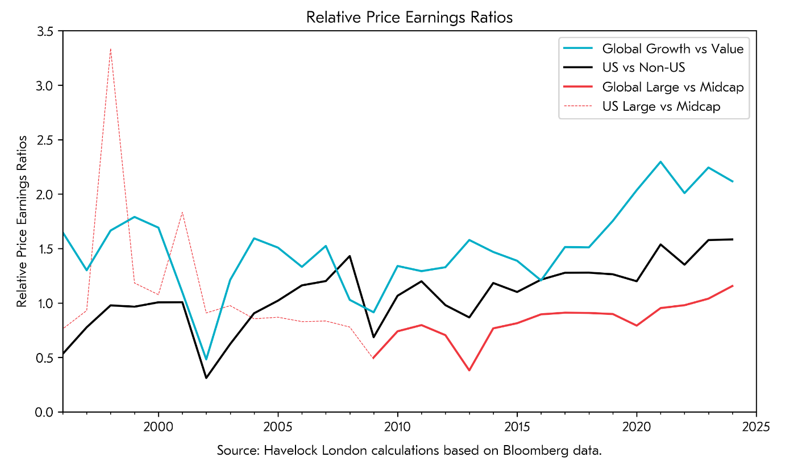
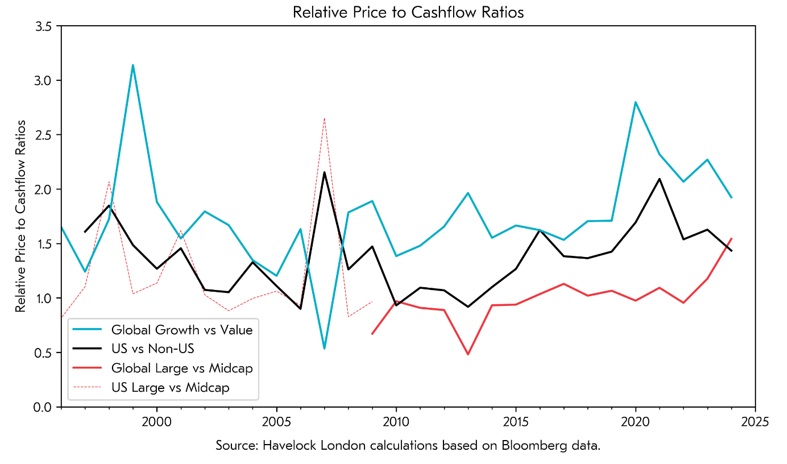
We used price earnings ratios based on 10-year average inflation adjusted earnings, as this removes the “noise” of individual years’ earnings. We also produced charts based on the prior year’s earnings and prior year’s cashflows, which show the same overall trends. These are shown below:


[1] The MSCI World size indices have a limited history, and so the size factor uses just US data prior to 2009.