As the name implies, when you own a share you own a slice of a business. The market price of your share should depend on the existing value in the business and the future value it is likely to create. In his Nobel prize winning work on the empirical analysis of asset prices, Professor Robert Shiller demonstrated that over the long-term, market prices do indeed track earnings.

However, in the same work Shiller showed that prices fluctuate more than they should if market participants were always responding rationally to new information. This means there are periods when prices and fundamentals dislocate. How you spot such a dislocation is an important, valuable, and difficult question to answer. In Figure 1 we see that the price-to-earnings ratio of the S&P 500 is high with respect to history[1], having only peaked above 30 twice before in the 150 years of data we have. Whether this does or does not represent a dislocation partly comes down to whether these stocks are set to experience a very high level of growth in their future earnings, among other factors.

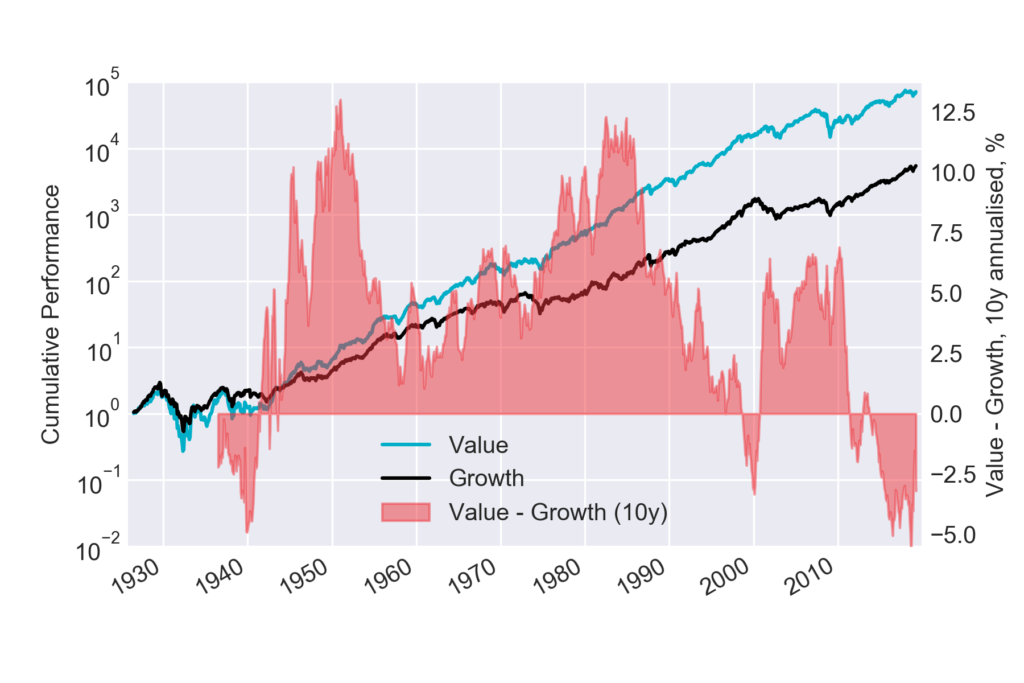
Much has been written about the relative performance of value and growth stocks during this long-in-the-tooth bull market. In Figure 2 we show the historic performance of a value and a growth portfolio since 1926[2]. In the last ten years (to Dec 2018), the value portfolio has returned 11.0% annualised, and the growth portfolio 15.1%. Such relative performance appears to be remarkable; across history value has rarely underperformed growth in any ten-year period.
But what exactly do the terms ‘value’ and ‘growth’ mean? A very specific methodology is used to define the portfolios shown in Figure 2[3], and many other methodologies exist using different fundamental metrics, metric combinations, datasets, selection criteria, and weightings. All applied to different universes of stocks.
Are the terms ‘value’ and ‘growth’ understood? And are they useful for making investment decisions?
Any metric based on recent realised fundamentals provides only a crude view of what you need to know to make good long-term investment decisions. You need to understand the future fundamentals of a company in order to know what price you should be paying for its shares. At Havelock London we do in-depth data-driven research into companies to understand their potential future earnings, and uncertainties. We are “valuation” investors rather than value investors. A stock doesn’t have to have a low price-to-earnings multiple for us to like it. But it does have to be trading at an attractive price, relative to realistic expectations of its earnings.
By using
data to identify companies that we believe are good quality and are trading at
attractive prices we are not simply ‘value’ or ‘growth’; we are both.
Footnotes
[1] Data courtesy of Prof Robert Shiller (http://www.econ.yale.edu/~shiller)
[2] Data courtesy of Prof Kenneth French (https://mba.tuck.dartmouth.edu/pages/faculty/ken.french/)
[3] The methodology follows that of the Fama-French “HML” factor; US stocks are ranked by price-to-book each year with the top and bottom 30% assigned to ‘growth’ and ‘value’ portfolios respectively. Equal weight is given to small and large stocks within each portfolio, to separate a value effect from a size effect.